
Solar
[sdo.gsfc.nasa.gov/assets/img/latest/mpeg/latest_10240193.mp4](sdo.gsfc.nasa.gov/assets/img/latest/mpeg/latest_1024_0193.mp4) _“Courtesy of @NASA/SDO and the AIA, EVE, and HMI science teams.”
ACE
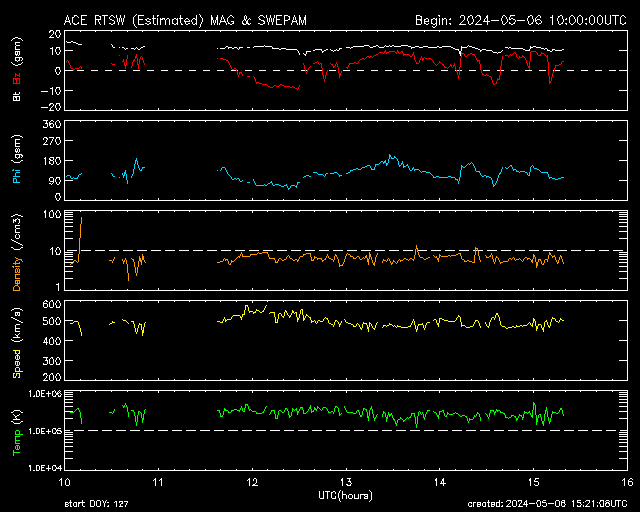
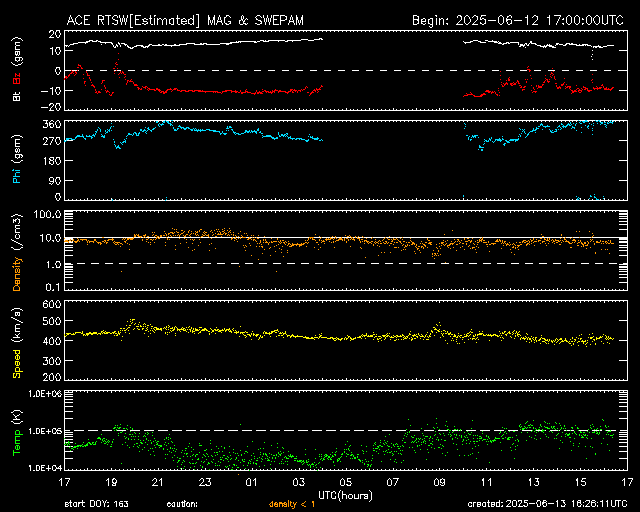
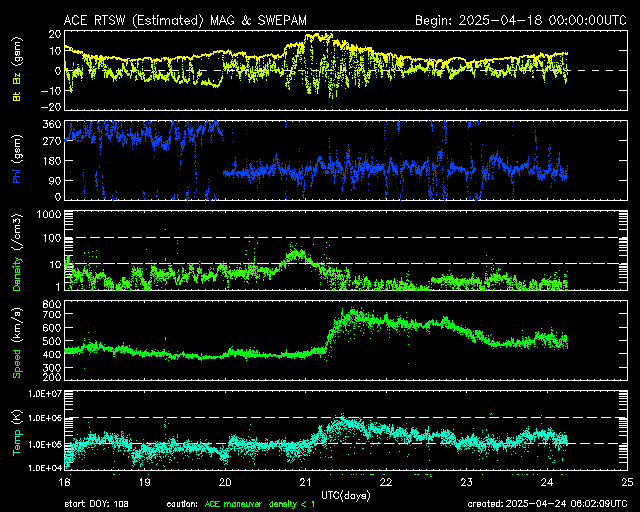
Real-Time Solar Wind [1] The NASA Advanced Composition Explorer (ACE) satellite enables SWPC to give advance warning of geomagnetic storms. Geomagnetic storms are a natural hazard, like hurricanes and tsunamis, which the National Oceanic and Atmospheric Administration (NOAA) Space Weather Prediction Center (SWPC) forecasts for the public’s benefit. Geomagnetic storms impact the electric power grid, aircraft operations, GPS, manned spaceflight, and satellite operations, to name some of the most damaging. Severe geomagnetic storms can result in electric utility blackouts over a wide area. spaceweather.gov/products/ace-real-time-solar-wind
6hr
24hr
7day
Radio
:Product: 3-Day Forecast
:Issued: 2026 Jul 10 1230 UTC
# Prepared by the U.S. Dept. of Commerce, NOAA, Space Weather Prediction Center
#
A. NOAA Geomagnetic Activity Observation and Forecast

The greatest observed 3 hr Kp over the past 24 hours was 4 (below NOAA
Scale levels).
The greatest expected 3 hr Kp for Jul 10-Jul 12 2026 is 4.00 (below NOAA
Scale levels).

NOAA Kp index breakdown Jul 10-Jul 12 2026

             Jul 10       Jul 11       Jul 12
00-03UT       2.00         3.67         3.33
03-06UT       3.00         2.00         3.00
06-09UT       3.67         2.00         2.67
09-12UT       3.00         2.67         2.33
12-15UT       2.00         2.67         2.33
15-18UT       2.33         2.67         3.33
18-21UT       3.00         2.67         3.33
21-00UT       3.67         3.00         4.00

Rationale: No G1 (Minor) or greater geomagnetic storms are expected.
Active conditions are likely 10-11 Jul due to coronal hole high-speed
stream effects and on 12 Jul due to glancing influences from a CME that
left the Sun on 09 Jul.

B. NOAA Solar Radiation Activity Observation and Forecast

Solar radiation, as observed by NOAA GOES-18 over the past 24 hours, was
below S-scale storm level thresholds.

Solar Radiation Storm Forecast for Jul 10-Jul 12 2026

              Jul 10  Jul 11  Jul 12
S1 or greater    1%      1%      1%

Rationale: No S1 (Minor) or greater solar radiation storms are expected.
No significant active region activity favorable for radiation storm
production is forecast.

C. NOAA Radio Blackout Activity and Forecast

No radio blackouts were observed over the past 24 hours.

Radio Blackout Forecast for Jul 10-Jul 12 2026

              Jul 10        Jul 11        Jul 12
R1-R2           25%           25%           25%
R3 or greater    5%            5%            5%

Rationale: There is a chance for R1-R2 (Minor-Moderate) radio blackouts
10-12 Jul due to the potential of Regions 4482 and 448

45thweathersquadron.nebula.spaceforce.mil/pages/launchForecastSupport.html
West

Band 15 - 12.3 µm - Dirty Longwave Window - IR - 15 Jul 2025 - 0140 UTC pdfguide
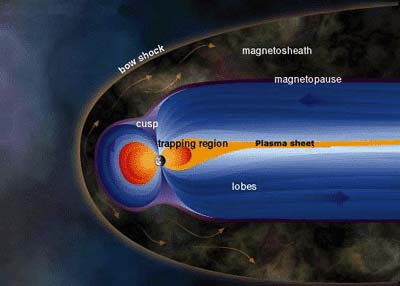 Diagram of Earth’s Magnetic Field
This diagram illustrates the solar wind flowing around and beyond Earth’s magnetic shield. This shield, the magnetosphere, is bullet-shaped, with a nose that lies about 64,000 kilometers (just over 39,768 miles) toward the Sun. Its outer layer, the magnetosheath, Earth’s Magnetic Field


GOES-West - Sector view: U.S. Pacific Coast -
East

Animated - https://cdn.star.nesdis.noaa.gov/GOES19/ABI/CONUS/DMW/GOES19-ABI-CONUS-DMW.gif

Lightning


ZiP - cdn.star.nesdis.noaa.gov/GOES19/ABI/CONUS/Dust/latest.jpg.zip


https://cdn.star.nesdis.noaa.gov/GOES19/ABI/CONUS/Dust/latest.jpg.zip

Falcon 9
nasa.gov/wp-content/uploads/2021/07/falcon9_crewdragon_launch_weather_criteria_fact_sheet.pdf

